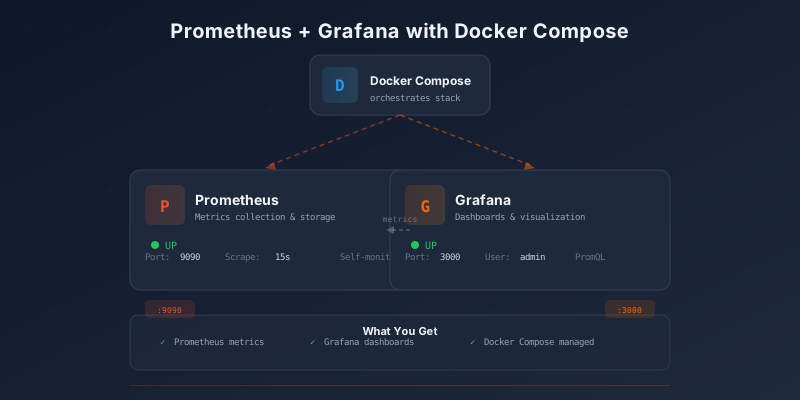
Prometheus + Grafana Setup Using Docker Compose
 NeeRoz M
Prometheus + Grafana Setup Using Docker Compose


This guide walks you through setting up Prometheus and Grafana using Docker Compose. Prometheus collects and stores metrics, while Grafana visualizes them in dashboards.
What We’re Building
Your Server
│
├── Docker
│
├── Prometheus ──── collects metrics
│
└── Grafana ─────── displays metrics
1. Check Docker Is Installed
Run:
docker --version
docker compose version
Expected output:
Docker version 28.x.x
Docker Compose version v2.x.x
If Docker isn’t installed, install Docker Desktop on Windows/macOS, or Docker Engine + Compose on Linux.
2. Create a Project Directory
mkdir monitoring
cd monitoring
Create these folders:
mkdir prometheus
mkdir grafana
Your directory should look like:
monitoring/
├── prometheus/
└── grafana/
3. Create Prometheus Configuration
Create:
monitoring/prometheus/prometheus.yml
global:
  scrape_interval: 15s

scrape_configs:
  - job_name: "prometheus"
    static_configs:
      - targets: ["prometheus:9090"]
What does this do?
This tells Prometheus: every 15 seconds, collect metrics from Prometheus itself.
The important part is:
targets: ["prometheus:9090"]
prometheus is the Docker service name, and 9090 is Prometheus’s internal port.
4. Create Docker Compose File
Inside monitoring/, create:
docker-compose.yml
services:

  prometheus:
    image: prom/prometheus:latest
    container_name: prometheus
    ports:
      - "9090:9090"
    volumes:
      - ./prometheus/prometheus.yml:/etc/prometheus/prometheus.yml
      - prometheus_data:/prometheus
    restart: unless-stopped

  grafana:
    image: grafana/grafana:latest
    container_name: grafana
    ports:
      - "3000:3000"
    volumes:
      - grafana_data:/var/lib/grafana
    restart: unless-stopped

volumes:
  prometheus_data:
  grafana_data:
Now your project looks like:
monitoring/
├── docker-compose.yml
├── prometheus/
│   └── prometheus.yml
└── grafana/
5. Start Everything
From the monitoring directory:
docker compose up -d
Check the containers:
docker ps
You should see prometheus and grafana running.
Check logs:
docker compose logs
Or specifically:
docker compose logs prometheus
docker compose logs grafana

6. Open Prometheus
Open your browser:
http://localhost:9090
Go to Status → Targets.
You should see:
prometheus UP
UP means Prometheus is successfully collecting metrics.
7. Open Grafana
Open:
http://localhost:3000
The default login:
| Field | Value |
|---|---|
| Username | admin |
| Password | admin |
Grafana will ask you to change the password after the first login.
8. Connect Grafana to Prometheus
Inside Grafana:
Connections → Data sources → Add data source
Choose Prometheus.
For the URL, use:
http://prometheus:9090
Important: Don’t use
http://localhost:9090inside Grafana.
Why?
Grafana is running inside a Docker container. From Grafana’s point of view, localhost means the Grafana container itself.
Docker Compose creates a network where containers communicate using their service names:
Grafana → prometheus:9090 → Prometheus
Click Save & test. You should get a successful connection message.

9. See Your First Metric
In Grafana, open Explore.
Select your Prometheus data source.
Try this query:
up
You should see:
up{instance="prometheus:9090", job="prometheus"} 1
The value 1 means Prometheus is up.
10. Create Your First Dashboard
Go to: Dashboards → New → New dashboard → Add visualization
Select Prometheus as the data source.
Try:
up
Choose a visualization such as Stat.
You now have your first Grafana panel.

11. Current Architecture
┌─────────────────┐
│    Grafana      │
│    :3000        │
└────────┬────────┘
         │
         │ PromQL
         ▼
┌─────────────────┐
│   Prometheus    │
│    :9090        │
└────────┬────────┘
         │
         │ metrics
         ▼
  Prometheus itself
There is one important thing missing: we aren’t monitoring your actual server/application yet.
12. Next Step: Node Exporter
If you want to monitor a Linux server, the usual next step is adding Node Exporter.
Node Exporter exposes metrics like:
- CPU usage
- RAM usage
- Disk usage
- Network traffic
- Filesystem usage
- System load
Your architecture would then become:
         ┌──────────────┐
         │   Grafana    │
         │    :3000     │
         └──────┬───────┘
                │
                ▼
         ┌──────────────┐
         │  Prometheus  │
         │    :9090     │
         └──────┬───────┘
                │
                ▼
         ┌──────────────┐
         │Node Exporter │
         │    :9100     │
         └──────────────┘
                │
                ▼
            Linux Host
13. Useful Docker Commands
| Command | Purpose |
|---|---|
docker compose down |
Stop the setup |
docker compose up -d |
Start it again |
docker ps |
See running containers |
docker compose logs -f |
Follow logs |
docker compose restart |
Restart everything |
Conclusion
You now have a working Prometheus + Grafana monitoring stack running in Docker Compose. Prometheus scrapes metrics every 15 seconds, and Grafana provides the visualization layer. From here, you can add Node Exporter for system metrics, or instrument your applications with client libraries to expose custom metrics.
Beginner tip: Don’t worry about understanding every line of
docker-compose.ymlyet. First get Prometheus + Grafana running, verify theupmetric, and then add Node Exporter and learn how Prometheus scraping works.
Table of Contents